
Data Analysis
Interactive charts powered by live API
Embedded Tableau for year-over-year trends
User behavior insight

CI/CD Skill
Branch-env strategy, automated tests, k6 perf tests
Dual pipelines: GitHub Actions + Jenkins

Cloud Engineer
Serverless API on AWS with Infrastructure as Code
API Optimization with Caching and Compression

System Administrator
Proxmox Virtual Environment with stable Internet access
Automate on-prem data warehouse deployment
Data Analysis
Select charts to visualize API data (https://trip.arguswatcher.net/prod/bike).
Explore year-to-year changes by selecting different years in the Tableau dashboard below.
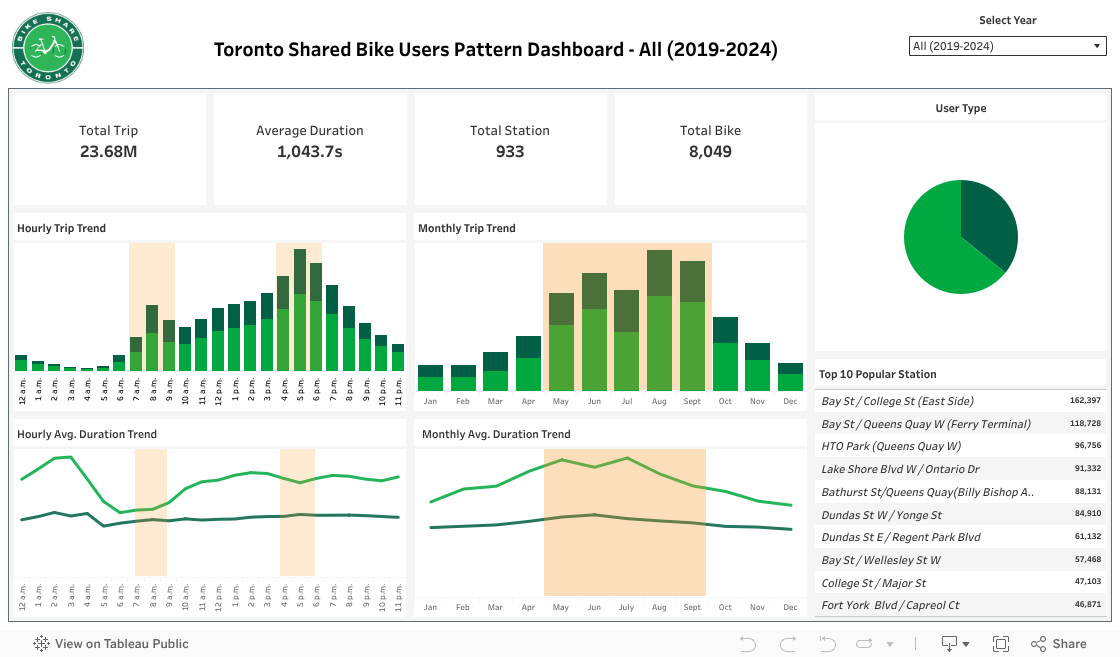
User Behavior Insight
Seasonal Patterns
Annual users and Casual users both ride more frequently during the warmer season.
Annual users maintain steady usage year-round, taking shorter trips that reflect routine, purpose-driven travel such as commuting.
Casual users ride less during winter but take longer trips in summer, indicating usage primarily for recreation or leisure.
Explore Details in DashboardHourly Patterns
Annual users and Casual users are both most active during rush-hour periods.
Annual users maintain short, consistent trip durations throughout the day, reflecting planned, purpose-driven usage, such as commuting.
Casual users generally take longer trips, suggesting occasional, convenience-focused or leisure use. However, they also make shorter trips during the morning peak.
Explore Details in DashboardLocation Patterns
Users frequently use shared bikes in the downtown core and around major transit nodes for last-mile travel.
Bikes are also popular in recreational areas, reflecting leisure-oriented usage.
Explore Details in DashboardDevOps - CI/CD Skill
Git Branching Strategy Diagram
Implement a branching strategy with GitHub Environments (dev/stage/prod)
to isolate and manage multiple environments.
Jenkins with GitHub Diagram
Secure the integration between the on-premises Jenkins and the remote GitHub repository by Cloudflare tunnel and GitHub webhook to sync Jenkins jobs and repository events.
GitHub Actions CI/CD
Implement a branching strategy with GitHub Environments (dev/stage/prod) to manage and isolate multiple environments.
Automate unit tests and lint checks on every PR via GitHub Actions to ensure code quality.
Integrate and visualize performance testing with Grafana K6 to enforce thresholds (error rate ≤ 0.01; p95 latency < 500 ms).
Jenkins CI/CD
Use JCasC (Jenkins Configuration as Code) to deliver consistent configurations and accelerate Jenkins provisioning. (e.g., automate plugin installation)
Leverage Jenkins Job DSL (Domain Specific Languages) with GitHub to codify and auto-provision jobs from the repo.
Secure the integration between on-premises Jenkins and remote GitHub repository by Cloudflare tunnel and GitHub webhook, to auto-sync Jenkins jobs with repository events.
DevOps - Cloud Skill(AWS)
Serverless API & IaC
Serverless API on AWS
Architecture (AWS)
Infrastructure as Code (Terraform)
REST API Optimization
Optimize REST API performance on AWS
Improve API performance
DevOps - System Administrator Skill
On-Prem Netowrk Design
On-Prem System Architecture
ETL Data Pipeline
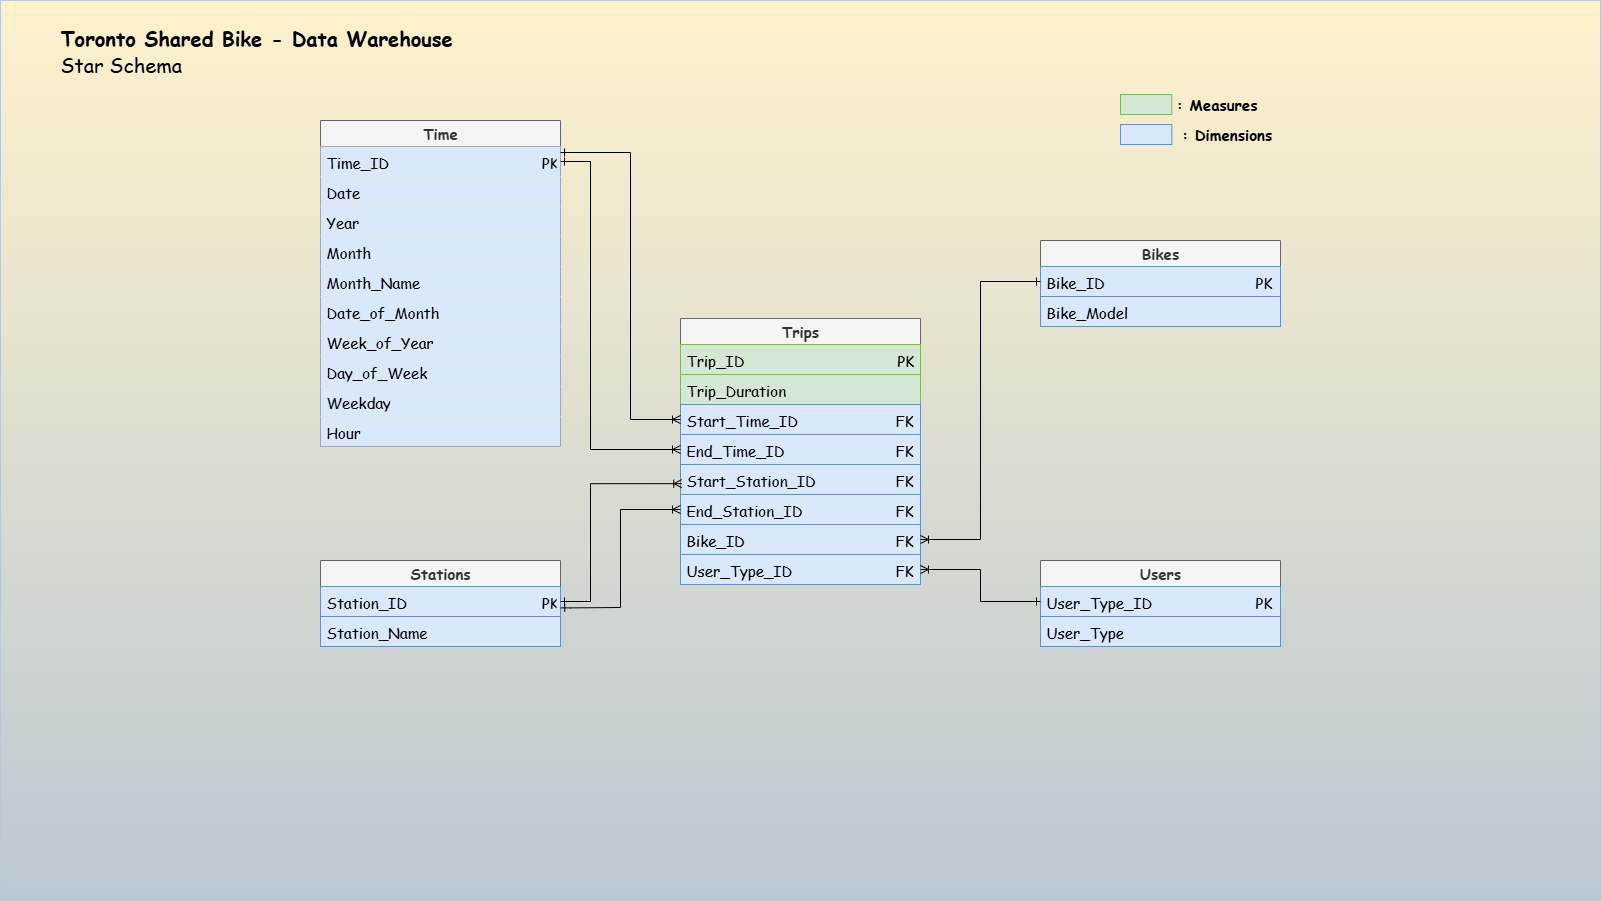
Start Schema
On-prem Environment Configuration
Convert a repurposed laptop into a homelab with Proxmox VE.
Enable Internet access for Promox via Wi-Fi using NetworkManager and iptables.
Enable Internet access and DHCP services for VMsusing pfSense.
On-prem Data Warehouse Deployment
Deploy Star schema data warehouse using PostgreSQL, along with ETL pipeline.
Monitor system performance using Prometheus and Grafana
Automate and accelerate deployment using Shell scripts & Configuration as Code (Jenkins & Grafana)